Your Working Capital Timeline
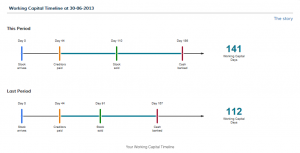
Understanding your Working Capital Timeline is a critical aspect of understanding your business.
On day zero the Stock arrives, that Stock is paid for 44 days later. 110 days after the Stock arrives it is sold. The Cash for the Sale is banked 76 days later. The total Working Capital Days are 141 this is the time that the business is ‘out of pocket’ from a Cash Flow perspective. The time between when the Stock is paid for compared to when the Cash is banked from that Sale. Your Cash Flow Report gives shows how this key financial indicator is working, or not working in your business.

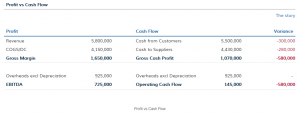
Profit vs Cash Flow
This Table compares each Profit line item with the equivalent Cash Flow and shows the difference between the recorded accounting amount and the actual cash received or paid out.
Revenue is compared to the actual Cash banked from the Sales. The cost of Goods/Direct Costs is compared to the actual Cash paid to suppliers. The Gross Margin can, therefore, be compared to the Gross Cash Profit. Overheads are compared to the Cash Overheads (Excluding Depreciation and Amortisation). Using your Cash Flow Report the Operating Profit can then be compared to the Operating Cash Flow.

Cash Flow Report and Profit vs Cash
Your Power of One
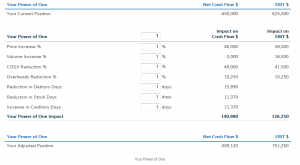
Your Power of One is your starting point in your journey to optimise your Company’s Cash Flow Excellence by understanding the 1% or 1-day changes in your 7 key drivers. Marketing, Operations and Finance all need to understand the Power of One as they can directly influence these drivers. The Power of One and your Cash Flow Report also shows you the sensitivity of each key driver to Cash Flow and Profit.
Focus on:
The effect that a 1% increase in Price will have compared to a 1% increase in Volume on both Cash Flow and Profit
The effect that 1% reduction in COGS and Overheads will have on Cash Flow and Profit
The impact on your Cash Flow of 1-day reduction in Debtors or Stock or a 1-day increase in Creditors

Cash Flow Report and Power of One
Your Current Business Value Indicator
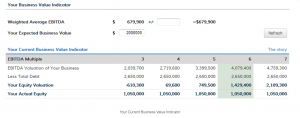
This table in your Cash Flow Report shows you the value of your Business and Equity based on a range of EBITDA Multiples from 3 to 7. The EBITDA Valuation of your business is calculated by multiplying your Weighted Average EBITDA by the EBITDA Multiples.
Your Total Debt is subtracted from this valuation, to show your Equity Valuation. This is then compared to your actual Equity. The highlighted column shows you at what Multiple the valuation of your Equity exceeds your actual Equity.
The graph shows your Current Equity Value for each Multiple. It also indicates how this compares to your Equity and to your Expected Valuation.
The methodologies used here can be compared to a Property that you purchase. If you buy a house for $1,000,000 and borrow $900,000 your Equity is $100,000. If the value of that house increases to $1,200,000 then by subtracting the Debt of $900,000, the value of your Equity is $300,000.

Cash Flow Report and Business Value Indicator